Up to now we only fetched single entries from the PicoLisp Database by specifying the entry ID in the URL. In this post, we will show how we can perform more complex queries to the database and display the output.
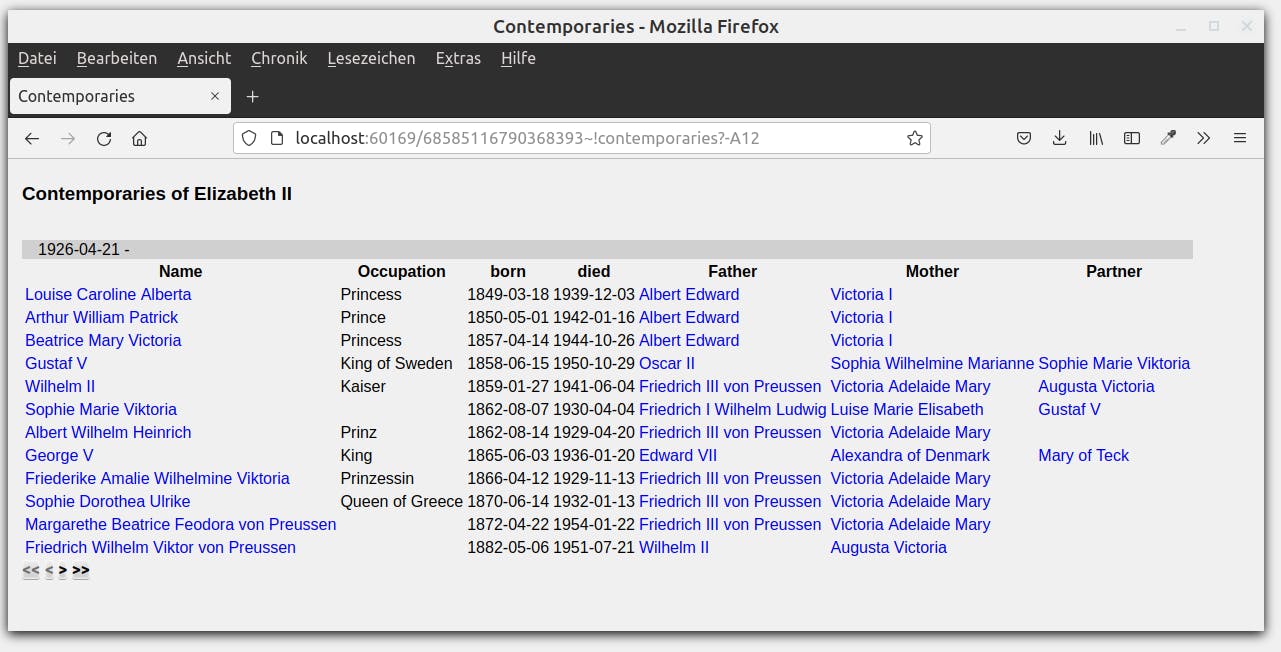
In this post, we will generate a web page that lists up all contemporaries of a person. This person is identified via the ID in the URL. In the end, it will look like this:

In the second step we will show how to generate a text- or PDF document out of the displayed content.
Adding the Contemporaries function
Let's take the family-edit.l file as a basis and rename it to family-contemporary.l.
First of all, we need a new function contemporaries. We need to add it to the allowed items too. The contemporaries function takes the variable *ID as argument:
(allowed ("css/")
   "@lib.css" "!person" "!treeReport" "!contemporaries")

...

(de contemporaries (*ID)
   (action
      (html 0 "Contemporaries" "@lib.css" NIL
]
The bracket ] closes all open parentheses. I think this is quite useful during the development.
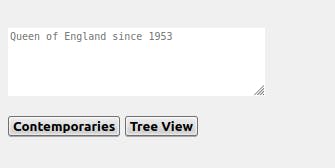
Now let's make our Contemporaries-Page reachable by a button on the main Person-page, like we did previously for the Tree Report as well.
(de person ()
    ...
            # Add link to contemporaries page
           (gui '(+Rid +Button) "Contemporaries"
               '(url "!contemporaries" (: home obj)) )
            (gui '(+Rid +Button) "Tree View"
               '(url "!treeReport" (: home obj))  ) ) ) ) )
When we execute this now with $ pil family-contemporaries.l -family~main -go +, we can see an additional button. When we click it, we get to a new (empty) page.

Set-up the form
Now we need to connect a form element to the current object using the <id> function, like we did in this post. Let's call <id> in the headline.
         (form NIL
            (<h3> NIL (<id> "Contemporaries of " (: home obj nm)))
With this, we can access the current person with (: home obj), and its name with (: nm).
Getting the "Contemporaries" from the Database
First of all we should clarify what we understand when we talk about "contemporaries".Let's define contemporaries as follows:
- A contemporary has been born +/- 10 years of the target person's birthday.
- died after the birth of the target person,
- was born before the death of the target person.
Let's see how we can translate this into a query.
For this, we use another GUI concept, the +QueryChart. The basic idea of the +QueryChart is to separate how data is presented in the gui from the internal representation. It has a Pilog query used to fetch the data we want to show from the database. This part is followed by a number which tells the Chart how many columns of data to show. The last part is a function that takes care of putting data into the chart gui from the dataset retrieved by the Pilog query.
Let's go through these step by step.
Part 1: The Pilog Query
We can construct a pilog query from a list of clauses using the goal function. First, let's define the conditions:
@Objis the current database entry, defined via theIDin the URL.@Datis the birthday of that person.@Begis a date 10 years prior to the birthday. 10 years correspond to approx. 32525 days.@Finis the object's death date or 10 years after its birthay.
'(goal
   (quote
      @Obj (: home obj)
      @Dat (: home obj dat)
      @Beg (- (: home obj dat) 36525)
      @Fin (or (: home obj fin) (+ (: home obj dat) 36525))
quote is equivalent to its short form '.
Let's start a query based on this information with the db function:
- Find a Person born between
@Begand@Finand unify that persons' entry with@@. @@and the current object should not be equal.
      (db dat +Person (@Beg . @Fin) @@)
      (different @@ @Obj)
Finally we add two filters:
- The birthday of
@Obj(the original person) should be before the other person's death day, - and the death day of the other person should be after the birthday of
Obj.
(; @@ fin) returns us the "death" property of an object. Then we can compare it with @Dat by using PicoLisp functions in a ^ clause.
       (^ @ (>= (; @@ fin) @Dat))
       (^ @ (<= (; @@ dat) @Fin)) ) )
Part 2: Returning the Pilog query data
The query will generate us a list of results. Let's say we want to create a table with the following columns: Name, occupation, born, died, father, mother, partner. This means our output table has seven columns. We add this information to our +QueryChart gui.
Also like any +Chart element, +QueryChart expects a number as argument that specifies the number of desired results (read here for more on +Chart). Let's say it should be 12.
(gui '(+QueryChart) 12
   '(goal
      (quote
         @Obj (: home obj)
         ...
         (^ @ (<= (; @@ dat) @Fin)) ) )
   7
Finally, let's add what should be returned: for each entry that the Pilog query returns, we want the seven attributes specified above:
   '((This)
      (list This (: job) (: dat) (: fin) (: pa) (: ma) (: mate)) ) )
What if we don't have a birthdate?
We need to catch one error: if the current object doesn't have a birthdate entry, we cannot execute this query. Let's catch this error: If the birthday is not available, we print out "No birth date", otherwise we run the query. So let's surround everything by ifn:
(ifn (: obj dat)
   (<h3> NIL (ht:Prin "No birth date for " (: obj nm)))
   (gui '(+QueryChart) 12
      '(goal
         ...
Display the results in a table
Now we use a table to return the result. First we define the title and the first row with the header (again, more explanation can be found in the ToDo-App example).
(<table> NIL (pack (datStr (: obj dat)) " - " (datStr (: obj fin)))
   (quote
      (NIL "Name") (NIL "Occupation") (NIL "born") (NIL "died") (NIL "Father") (NIL "Mother") (NIL "Partner") )
Then the table body: we already know that the table has seven columns and twelve rows. The order is already defined: (list This (: job) (: dat) (: fin) (: pa) (: ma) (: mate)). We only need to set the correct GUI element: Textfields for text elements and date fields for dates.
All items should be non-editable, therefore we use the prefix class +ObjView instead of Obj.
(do 12
   (<row> NIL
      (gui 1 '(+ObjView +TextField) '(: nm))
      (gui 2 '(+TextField))
      (gui 3 '(+DateField))
      (gui 4 '(+DateField))
      (gui 5 '(+ObjView +TextField) '(: nm))
      (gui 6 '(+ObjView +TextField) '(: nm))
      (gui 7 '(+ObjView +TextField) '(: nm)) ) ) )
Finally, we add (scroll 12) to add the navigation to the table with page size 12.
Finally, it looks like this:

Now we could also add some styling, but let's just leave it like this for now! In the next post, we will see how we can create downloadable documents in .txt and .pdf format.
The program up to this point can be found here.
Sources
software-lab.de/doc/form/refQ.html#+QueryCh..
software-lab.de/doc/app.html

