One of the many nice things of PicoLisp is that it comes with a built-in database. This makes it easy to collect and store our own data, for example via a mobile app. But not all data is best represented in tables and lists: sometimes a colorful little graph says more than 1000 numbers.
So how to transform the database output into this colorful graph? Luckily, we don't need to re-invent the wheel - data visualization can be very easy for example with a little help from the JavaScript D3.js library.
In the following post, I will explain how I created the little demo page that you can also visit with this link.
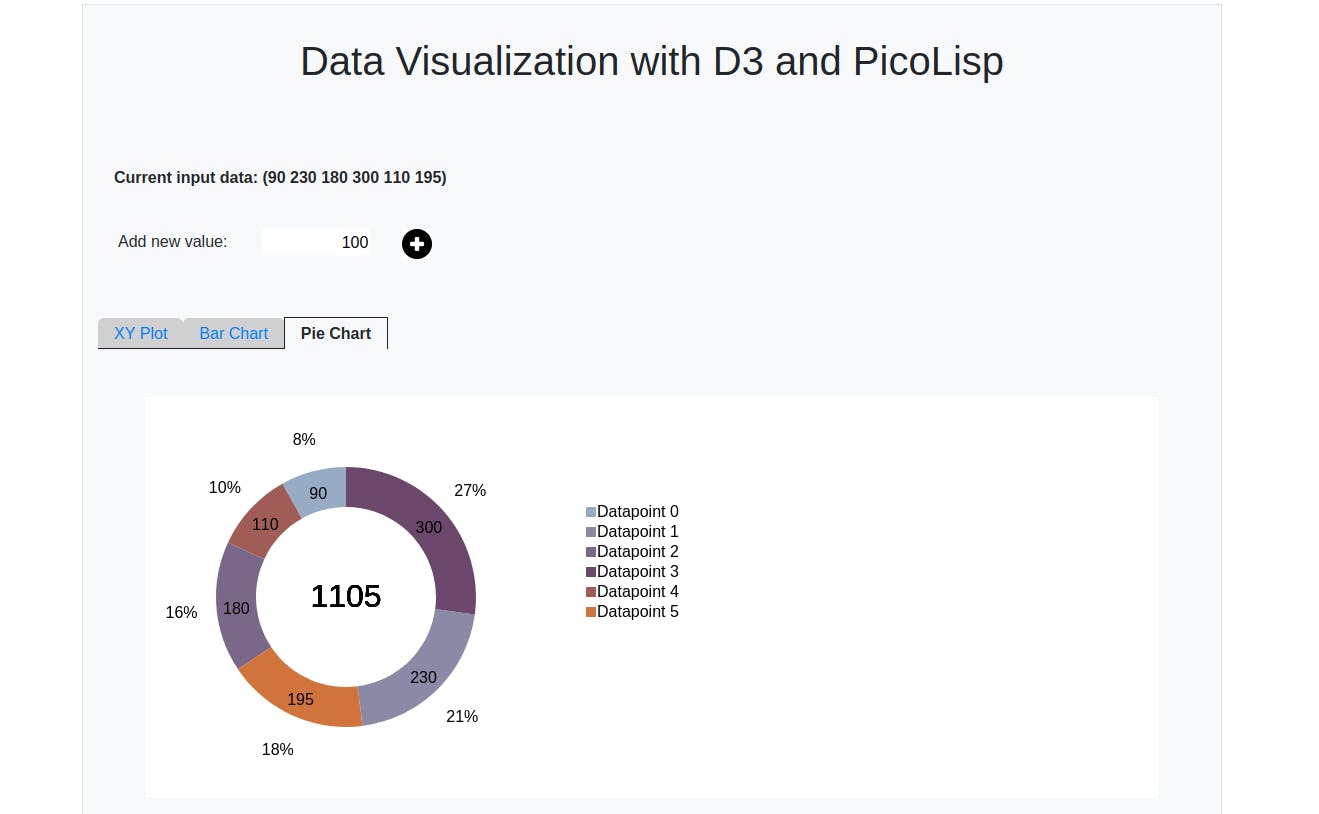
About D3.js
D3.js is an open-source JavaScript library that makes it possible to create pretty and flexible graphs in quite an easy way. It is not the only data visualization library - alternatives are for example charts.js or vis.js. But at the point of writing this post, D3.js the project with the largest community and it comes with a pretty good documentation.
With help of D3.js, we can keep the data separate from the visualization. For example, we can retrieve data dynamically from the PicoLisp database or from user input, and feed this data into the JavaScript function. All we need is to define the DOM object where the graph should be created.
A minimal example
Let's take a look at a truly minimal example (no PicoLisp).
Let's assume we have a (JavaScript array) var data = [90, 100, 30, 80]. Then the corresponding bar plot will be defined like this:
<!DOCTYPE html>
<html lang="en">
<head>
   ...
<script src="https://d3js.org/d3.v3.min.js" charset="utf-8"></script>
<style> ... </style>
</head>

<body>
<script type="text/javascript">
var data = [150, 230, 180, 90];
var svg = d3.select("body")
   .append("svg")
   .attr("width", 300)
   .attr("height", 200);
svg.selectAll(".bar")
   .data(data)
   .enter()
   .append("rect")
   .attr({
      class : "bar",
      width : function(d) {return d;},
      height: "40",
      y : function(d, i) {return i*50 + 10;},
      x : "10"
   });
</script>
</body>
</html>
And this is how it looks like:

First of all, we need to include the D3.js source file in the header of our HTML page.
<script src="https://d3js.org/d3.v7.min.js"></script>
The actual graph is defined in the second <script> </script> tag. There we create an SVG element with in the specified DOM object (in this case simply<body>). Then we append rect (rectangular) elements to it. The position and size of the rectangles is defined by the values of the data array.
Since this is not supposed to be a JavaScript tutorial, we will not go into further depth with this topic. But there are plenty of great resources about D3.js - you only need to be careful to use the correct version, because the releases are partially not backwards-compatible. This post uses the most recent version D3.v7.min.js.
Calling D3.js from PicoLisp
Now let's recreate the same thing with PicoLisp. First we need to wrap the JavaScript code from above into a function and save it in an external file. As a reference, I created three graphs (click on the link to see the source code):
All three functions take four arguments: the data array, the DOM-id of the div where the graph should be created, and the width and height of the graph.
function drawXYGraph(data, id, w, h) {

      var svg = d3.select(id)
      .append("svg")
      .attr("width", w)
      .attr("height", h);

...
Then we create the PicoLisp main file and load these javascript functions, as well as the D3 library itself.
(load "@lib/http.l" "@lib/xhtml.l" "@lib/form.l")
(setq *Css '("@lib.css" "css/bootstrap.css" "css/custom.css"))

(de work ()
   (and (app) *Port% (redirect (baseHRef) *SesId *Url))
   (action
      (html 0 "D3.JS in PicoLisp" *Css NIL
         (javascript "https://d3js.org/d3.v7.min.js")
         (javascript "js/barGraph.js")
         (javascript "js/xyGraph.js")
         (javascript "js/pieGraph.js") ) ) )

(de go ()
   (server 8080 "!work") )
Note: go back to the previous tutorials in the Web app series if you don't understand this.
You can start the server with:
pil <filename> -go
and should be able to see a blank HTML page on localhost:8080. With Ctrl+U (Firefox), you can view the page's source code and double-check that the JavaScript sources are included:
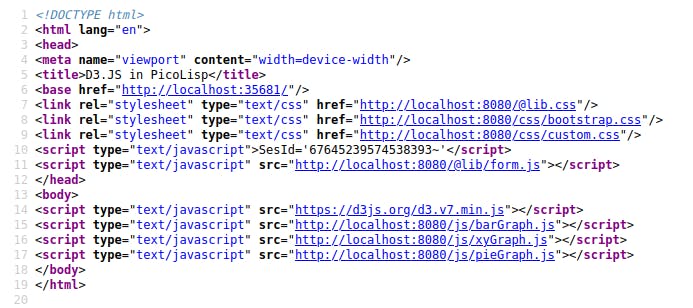
Now, all we need to do is create the data array and call the Javascript function. First of all, we define a global variable *Data (eventually, this data could for example come from a database):
(setq *Data (90 230 180 300 110 195))
Then we create a div with the id xyGraph within the HTML-body:
(<div> '(id . "xyGraph"))
Then we call the JavaScript function we just included. Since JavaScript uses arrays, not list, we need to convert our list to a JavaScript array with help from the glue function. From the docs:
(glue 'any 'lst) -> sym
Builds a new transient symbol (string) bypacking theanyargument between the individual elements oflst.: (glue "," '(a b c d)) -> "a,b,c,d"
Applied to our example:
(<javascript>
   " var data = [" (glue ", " *Data) "]; "
   "drawXYGraph(data, xyGraph, 400, 400); " )
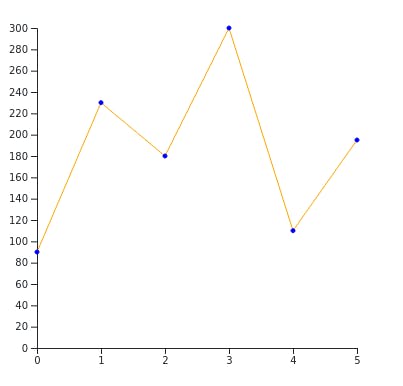
And we see the graph appearing:
The finished demo page
I have expanded the example above by an input field that allows the user to add new data points to the list, which causes the graph to update automatically. You can test it out here.
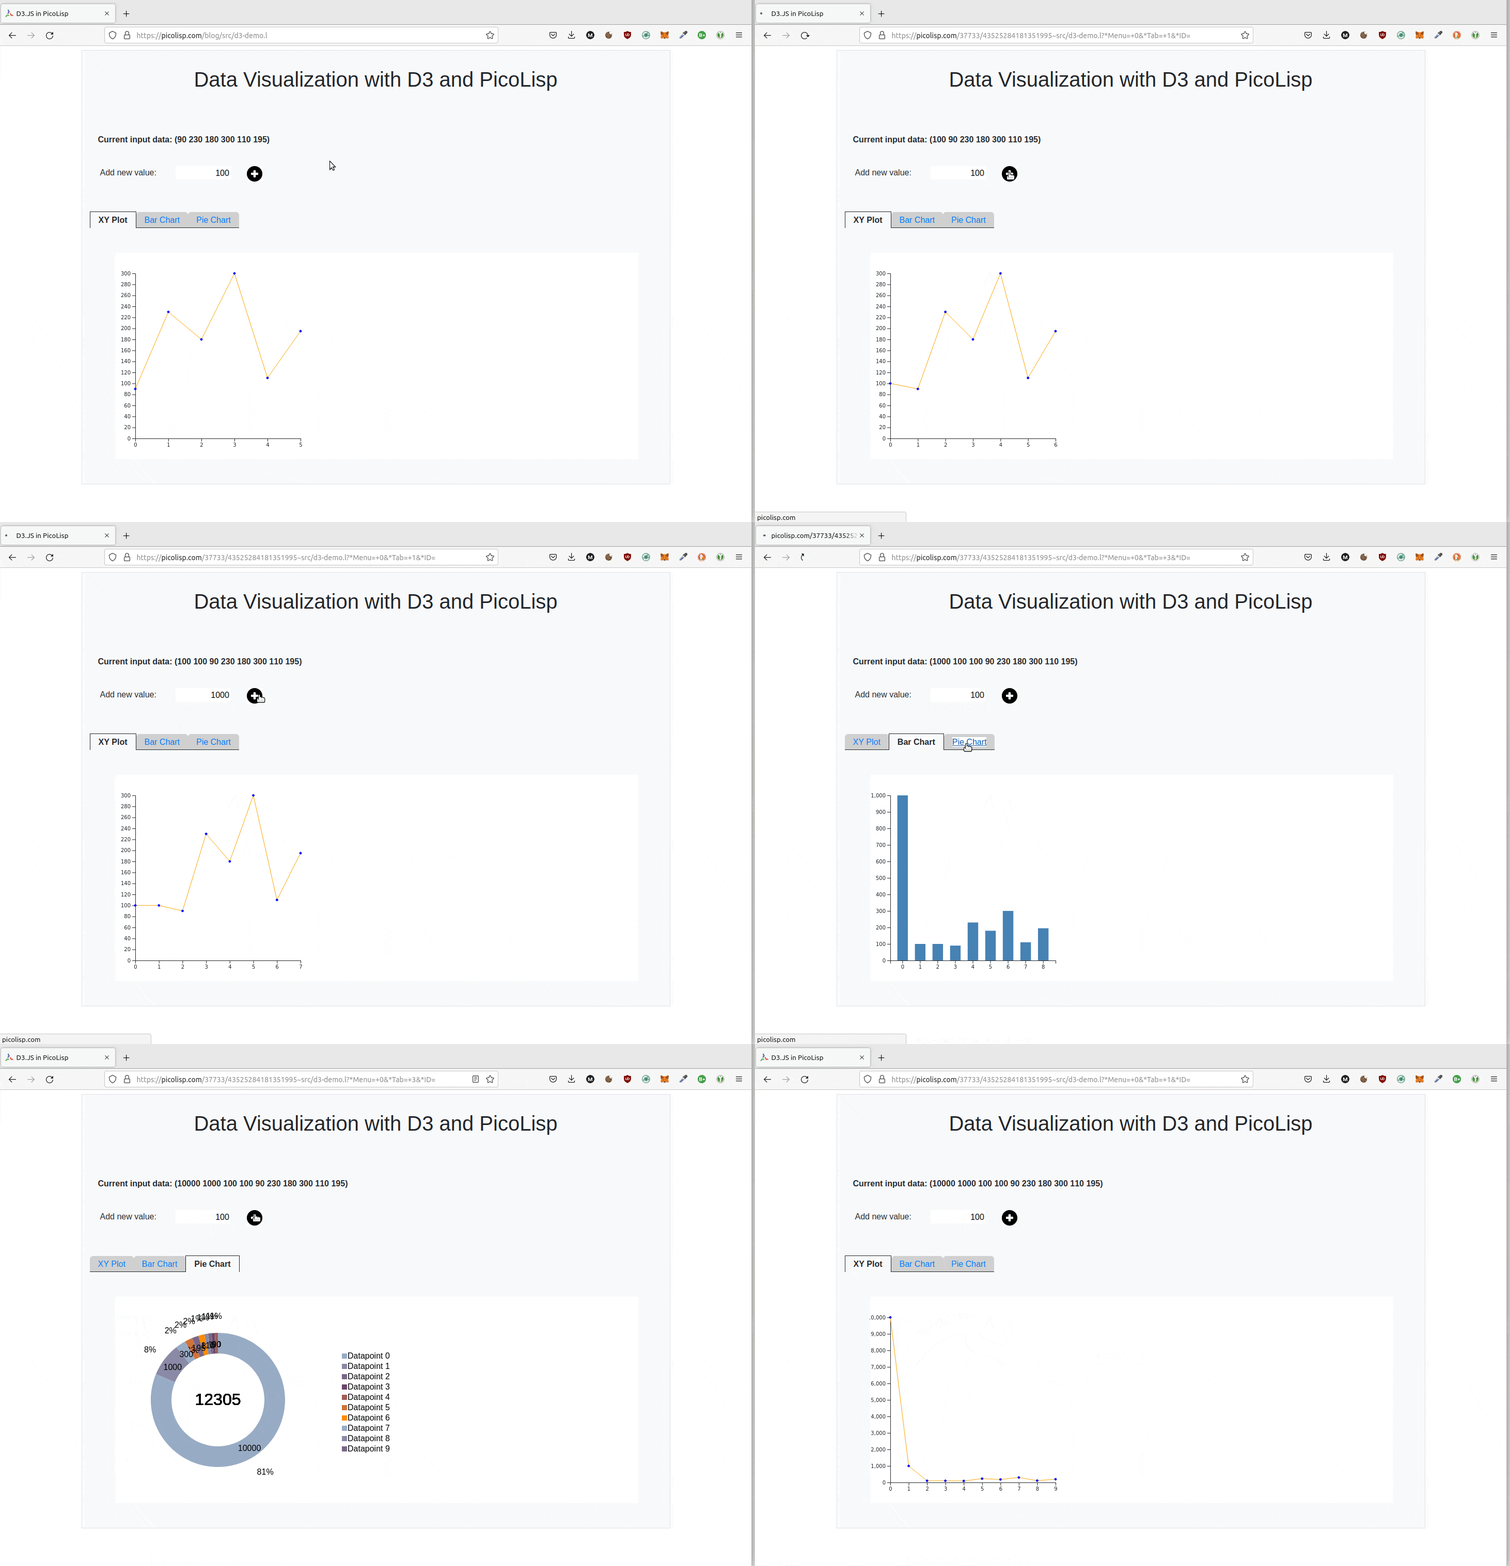
The full source code can be viewed here.

